On August 22, 2023, a joint research team from the University of Waterloo and Harvard Medical School published a paper titled “Controlled Tumor Heterogeneity in a Co-culture System by 3D Bio-Printed Tumor-on-Chip Model” in the journal Scientific Reports. This study pioneered the development of a 3D bioprinted in vitro model replicating the breast cancer tumor microenvironment. The model consists of co-cultured cells distributed within a hydrogel matrix with meticulously controlled architecture, accurately mimicking tumor heterogeneity. This innovation provides an invaluable tool for studying cancer cell behavior with exceptional spatial and temporal resolution.
Printability and Mechanical Properties of Bioinks
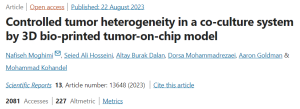
In preliminary studies, various hydrogels were prepared using different ratios of sodium alginate (1-10%) and gelatin (4-10%). A smaller nozzle diameter resulted in higher resolution but increased cell damage due to elevated extrusion pressure. Conversely, larger nozzle diameters, while sacrificing shape fidelity at low pressure, provided optimal conditions for cell survival. In this study, each hydrogel was printed using two nozzle diameters: 25G (red, 250 µm i.d.) and 22G (blue, 410 µm i.d.). Figure 1A illustrates the biofabrication process and printed structures, while Figure 1B showcases the resulting construct. After mixing hydrogel and cells to create bioink, two print heads were employed to sequentially print A-type cells and B-type cells. The printed constructs underwent a 10-minute immersion in CaCl2 cross-linking. Following a PBS rinse, each construct was placed in cell culture medium and incubated at 37°C.
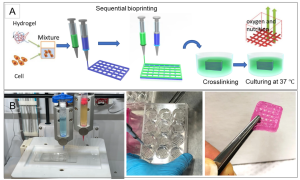 Figure 1. Schematic of the Biofabrication Process
Cell Viability Assay
To observe cell distribution within the printed construct, the cell membrane was pre-stained with a green fluorescent membrane marker (PKH67) before printing and examined using a confocal microscope immediately afterward (Figure 2A). Cell viability, a crucial factor in successful cell-printed construct production, was assessed by determining the percentage of viable cells to total cells. Calcium-acetoxymethyl green fluorescence stained live cells, while propidium iodide red fluorescence stained dead cells (Figure 2B). For hydrogels A1G4, A4G4, A8G4, and A1G8, the survival rates of MDA-MB-231 cells immediately after printing were 94.16%, 96.94%, 75.96%, and 84.7%, respectively. Representative images for A4G4 are displayed in Figure 2C, where green indicates live cells and red indicates dead cells. Figure 2D presents a three-dimensional Z-stack confirming the homogeneity of viable cells in the construct.
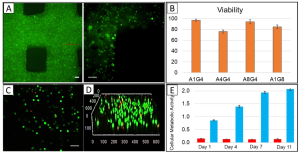 Figure 2. Distribution and Viability of Bioprinted MDA-MD-231 Cells
MTT assays were conducted on three replicates of 3D bioprinted constructs immediately after printing and then incubated in DMEM (containing 10% FBS and 1% penicillin-streptomycin) at 37°C with 5% CO for 4, 7, and 11 days. The results, showed in Figure 2E, display a clear and even cell distribution, with an absorbance value of approximately 0.86 ± 0.02 immediately after printing. After 4 days of incubation, the absorbance value increased to 1.39 ± 0.05 and further to 1.94 ± 0.04 on day 7. Although the survival rate continued to rise throughout the week compared to day 1, on day 11, the absorbance decreased to 2.07 ± 0.06, indicating a decline in cell proliferation. It appears that between days 7 and 11, the construct reached its maximum cellular capacity, leading to the initiation of cell death.
3D Bioprinted Co-Cultures
MCF7 cancer cells, a breast adenocarcinoma cell line, and MDA-MB-231, a more aggressive triple-negative breast cancer cell line with stromal characteristics, were pre-stained with green and red markers, respectively, before printing.. In the initial printing process, two bioinks were prepared for each cell type and printed sequentially. The first layer consisted of MDA-MB-231 cells (red staining), followed by the second layer of MCF7 cells (green staining). In a subsequent printing experiment, a bioink was prepared by mixing the two pre-stained cells in a hydrogel, and bioprinting was performed layer by layer as before. Figures 3A and 3B depict confocal images of continuously bioprinted cells and a bioprinted structure consisting of a mixture of the two cell types. In another experiment, a mixture of MCF7 and MDA-MB-231 cells was co-cultured in a two-dimensional chamber. Figure 3C-E illustrates that at the edges of the 2D culture chamber, the number of cells and cell proportions differ from those in the middle of the chamber. In contrast, within the 3D bioprinted structure, the cells are evenly distributed.
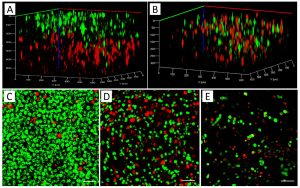 Figure 3. 3D Rendered Confocal Images of MCF7 (Green) and MDA-MB-231 Cells (Red)
Migration Response of Cells in Response to Chemotaxis Inducers
The researchers utilized epithelial growth factor (EGF), a chemotactic substance, to observe cell migration in co-cultures within microfluidic devices. Extracellular biomolecule gradients were dynamically generated in a 3D hydrogel matrix through linear gradients designed to replicate the chemical environment in tumor tissue, guiding cell migration. Figure 4A illustrates a COMSOL simulation of the device, where the Navier-Stokes equations and convection-diffusion equations were solved using the finite element method. In the figure, red and blue colors represent higher and lower concentrations, respectively. The diffusion coefficient used was 109 m2/s, a typical value in aqueous solutions.
 Figure 4. COMSOL Simulation Setup
To confirm chemical gradients, cell culture medium and FBS were used as sources at the inlet to visually confirm diffusion. Figure 4B displays a chamber picture with a flow rate of 20 μl/min at 5-minute intervals. Generating and acquisition of this gradient without flow takes at least 5 hours. The mixed MCF7 and MDA-MB-231 co-culture (Figure 3B) was constructed to study the migration of these different cancer cells toward chemotaxis inducers. MDA-MB-231 showed significantly higher migration compared to MCF7 cells, leading to its selection for the subsequent cell migration studies. The results align with previous studies on MCF7 and MDA-MB-231 cell migration towards chemoattractants in microfluidic devices. Bioprinted constructs, including MDA-MB-231 (green label) and MCF10A (red label), were placed into the gradient chamber. Figures 4C-E show case various tumor structures of bioprinted MDA-MB-231 and MCF10A cells, with MDA-MB-231/MCF10A ratios being 1/1 (S11), 1/4 (S14) and 4/1 (S41). The left image illustrates the distribution of MDA-MB-231 and MCF10A in tumors before EGF exposure, while the right image displays the distribution after EGF exposure. The bar graph presents the total percentage of MDA-MB-231 cells before and after EFG exposure. Notably, the highest migration tendency is observed when the ratio of cancer cells to surrounding non-cancer cells is 1:1 (Fig. 4C).
Summary and Discussion
The development of tumors and cells in the microenvironment involves interactions through the secretion of cytokines and growth factors. Apart from cancer cell-stromal cell heterogeneity, individual tumors also exhibit heterogeneity. Within individual cancers, different subpopulations of cancer cells possess varying migratory abilities due to differential expression of tumorigenicity, signaling pathways, migration, and response to anticancer drugs. Therefore, effective models should accurately represent tumor heterogeneity, providing not only a microenvironment for 3D cell growth but also facilitating cell-cell interactions to study cancer progression. This study demonstrates a strategy that combines 3D bioprinting and microfluidic devices to create unique tumor structures typical of those observed in different individuals. This tumor-on-a-chip model may significantly contribute to a high-resolution understanding of cancer cell behavior in heterogeneous tumors and their microenvironments, offering crucial insights into predicting future metastasis timing.
Reference:
Moghimi N, Hosseini S A, Dalan A B, et al. Controlled tumor heterogeneity in a co-culture system by 3D bio-printed tumor-on-chip model. Scientific Reports, 2023, 13(1): 13648.
Related Services: